
|
Number of bushfire's per year This graph represents the number of bushfires per month between 2003 - 2007.
|

|
Bushfire's in AustraliaThis map of Australia is indicating what places are most likely to be affected by bushfire's in 2014 and 2015.
|
|
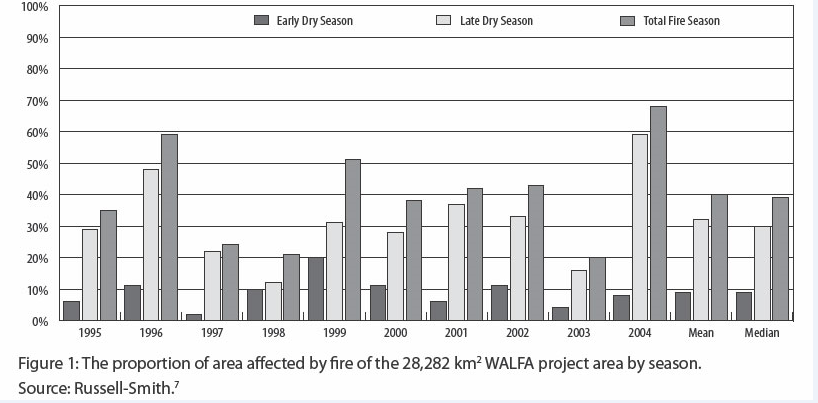
Fire SeasonsThis graph shows the percentages of land affected by bushfires.
|
